
Table of Contents
- Value Stream Mapping Process: A Step-by-Step Guide
- Core Value Stream Mapping Symbols
- The Value Stream Mapping Process: Ten Steps
- Step 1: Define the Customer and Value
- Step 2: Select and Scope the Value Stream
- Step 3: Assemble a Cross-Functional Team
- Step 4: Walk the Value Stream and Gather Data
- Step 5: Draw the Current-State Map
- Step 6: Identify the Eight Types of Waste
- Step 7: Analyse Flow Metrics
- Step 8: Design the Future State
- Step 9: Build an Improvement Roadmap
- Step 10: Implement, Measure, and Iterate
- Documenting and Presenting a Value Stream Map
- Tools and Templates for Value Stream Mapping
- Limitations and What Comes Next
- Certification and Professional Development
- Conclusion
- FAQs
Value Stream Mapping Process: A Step-by-Step Guide
The value stream mapping process is a structured method for understanding how work, information, materials, and decisions move through the activities required to deliver a product, service, or outcome to a customer. Rather than examining one team or process in isolation, it reveals the end-to-end flow, including work performed, queues, hand-offs, information controls, and elapsed time.
The purpose of the value stream mapping process is not simply to produce a diagram. It is to help an organisation see where value is created, where it is delayed or weakened, and which parts of the system should change to improve customer outcomes, speed, quality, and predictability.
This whole-system view distinguishes value stream mapping from ordinary process documentation. A process map usually explains how one activity is performed. A value stream map shows how several activities combine to produce an outcome and makes waiting, work in progress, rework, fragmented information, and competing priorities visible.
At enterprise level, value stream mapping remains a diagnostic technique rather than a complete operating model. It can show where flow is breaking down, but it does not by itself determine ownership, funding, governance, decision rights, or architecture. Those questions belong to the wider value stream operating model.
The Origins of Value Stream Mapping in Lean Thinking
The method is most strongly associated with the Toyota Production System, where it developed as a way of representing material and information flow across production.
Its importance lay in shifting attention away from isolated efficiency and towards the performance of the whole system. A department can appear productive while creating inventory, congestion, and delay for the next activity. Every team can be busy while the customer still waits.
Value stream mapping became widely known through lean management literature, particularly Learning to See by Mike Rother and John Shook. It helped organisations analyse the complete path from demand to delivery rather than treating each operational problem separately.
That principle remains relevant in modern enterprises. High utilisation within every team can reduce the system’s ability to absorb variation, respond to urgent demand, or resolve problems. Local efficiency does not always create end-to-end flow.
How Value Stream Mapping Has Evolved for Digital Enterprises
In digital organisations, the value stream mapping process applies lean principles to flows in which the item moving through the system may be information, knowledge, a decision, a customer request, or a software change rather than a physical product.
Physical inventory becomes work waiting in a backlog. Transportation becomes movement between teams or systems. Defects become incorrect data, incomplete submissions, failed tests, or misunderstood requirements. Rework becomes repeated analysis, correction, retesting, or resubmission.
Digital value stream maps can expose:
- Approval and governance delays.
- Waiting between specialist teams.
- Dependencies on shared services.
- Work moving between platforms.
- Repeated translation of requirements.
- Delays between deployment, adoption, and realised value.
- Excessive portfolio work in progress.
In software delivery, for example, a map may follow work from the identification of a customer need through prioritisation, funding, design, development, testing, release, adoption, and benefit realisation. This is broader than measuring the delivery pipeline alone because deployment does not guarantee that customer value has been created.
Digital value stream management platforms can provide ongoing flow data, including lead time, throughput, work-item age, quality, and work in progress. However, tools cannot always explain why funding is fragmented, why decision rights are unclear, or why several streams depend on the same scarce capability. The data must still be interpreted in its organisational context.
Why Enterprise Leaders Are Returning to Value Stream Mapping
The renewed interest in value stream mapping reflects a common enterprise problem: organisations have improved individual teams without resolving the structural conditions that obstruct end-to-end delivery.
Agile teams may work quickly but wait for approval. Product leaders may prioritise effectively but lack control over the people or platforms needed to deliver. Technology teams may automate deployment while funding and governance remain slow and project based.
Value stream mapping helps leaders see several persistent problems.
Functional Fragmentation
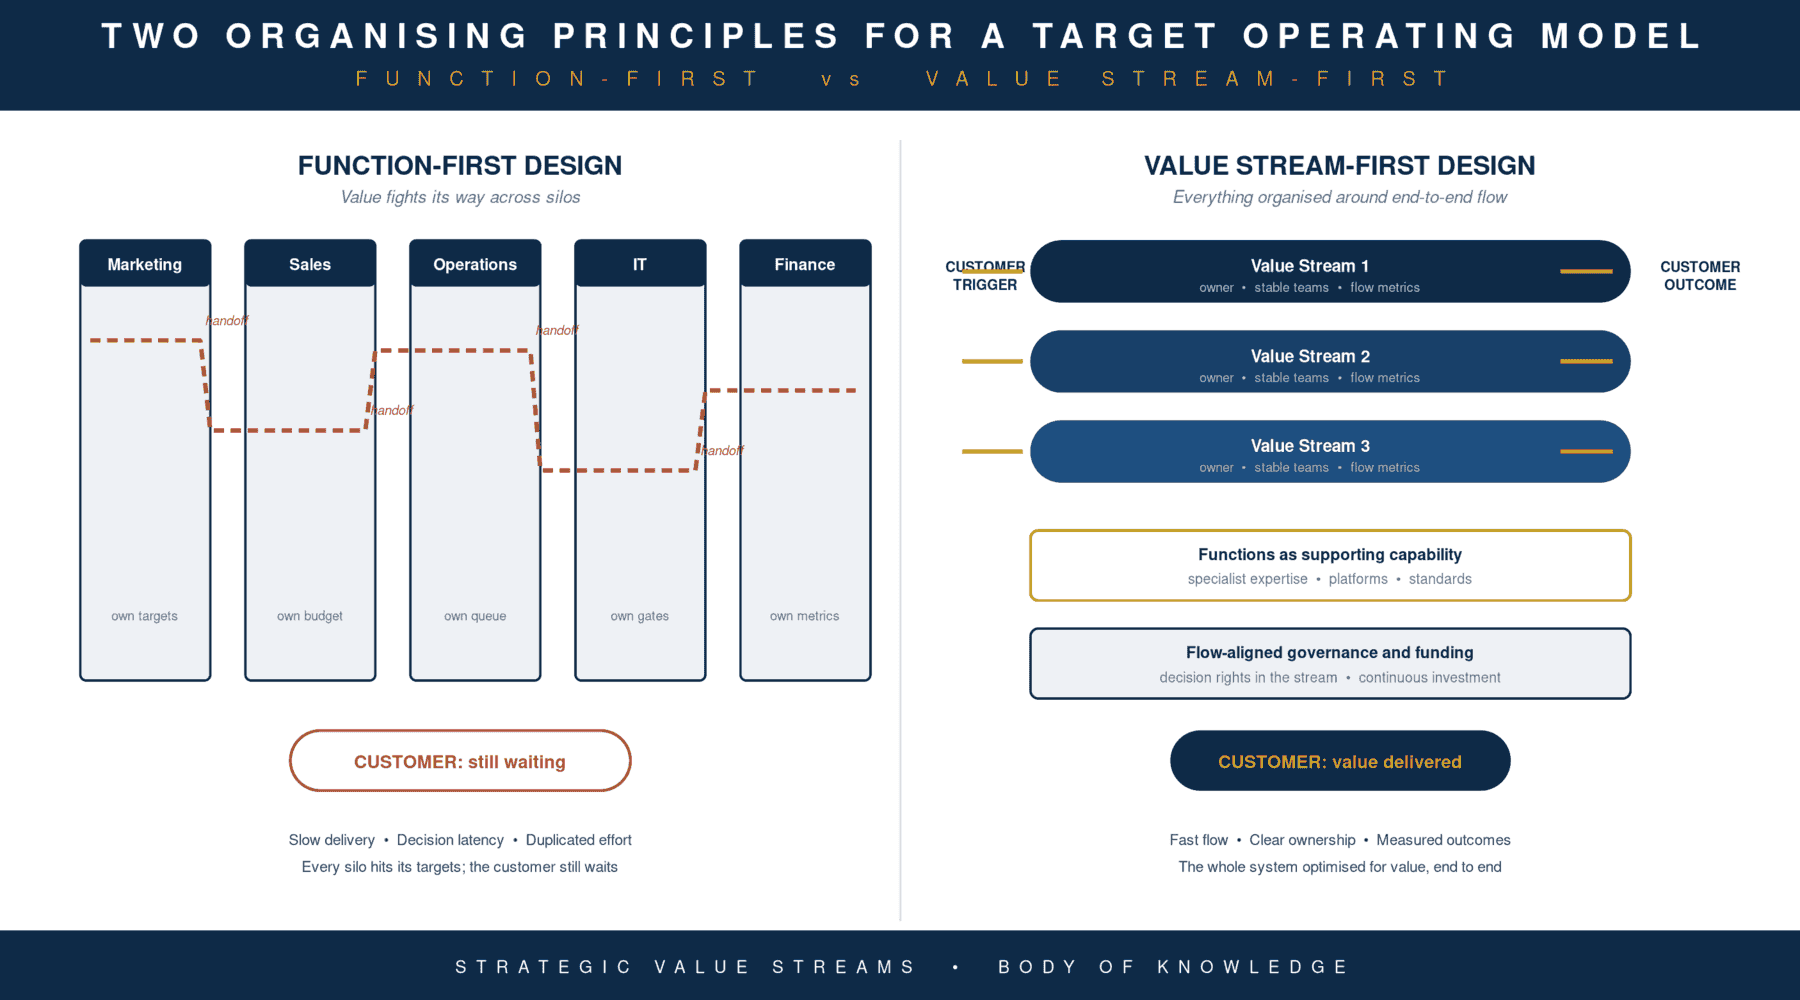
Work crosses functions, but budgets, measures, and authority remain tied to departments. Each function may optimise its own performance while increasing delay elsewhere.
Excessive Hand-Offs
Every hand-off introduces waiting, coordination, interpretation, and potential information loss. The greater the distance between those requesting, designing, approving, building, and operating the work, the greater the coordination burden.
Hidden Queues
Digital work accumulates in backlogs, reviews, approval lists, shared-service requests, and release schedules. Because this inventory is spread across systems, leaders may underestimate how much unfinished work exists.
Misaligned Measures
A team can meet its target by moving work quickly to another team, while overall lead time and customer experience deteriorate.
Strategy-to-Delivery Disconnection
Strategic priorities can become diluted as they pass through portfolio governance, funding, and delivery. By the time work reaches teams, the relationship between the original objective and the expected customer outcome may be unclear.
A map cannot solve these problems alone, but it can create a shared view of the system and identify where deeper operating model redesign is needed.
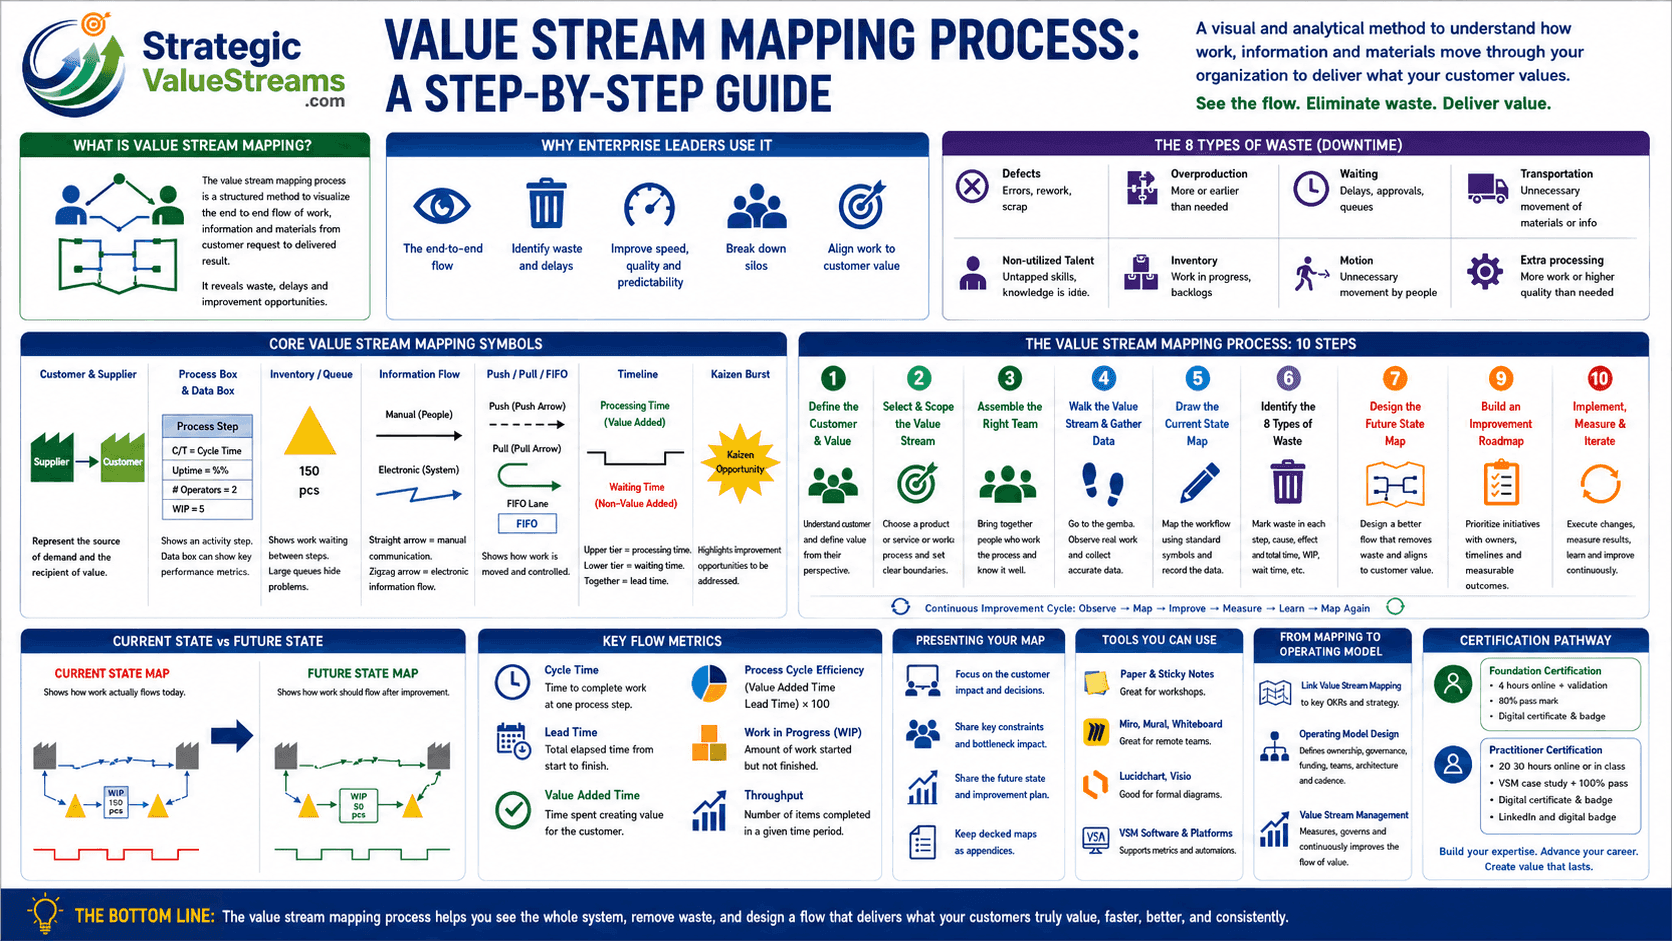
Core Value Stream Mapping Symbols
Consistent symbols make a map easier to understand across teams and functions. Organisations can adapt the notation for service or digital work, but every map should include a clear legend.
Customer and Supplier Symbols
Customers and suppliers are traditionally represented by factory-shaped icons. The supplier appears on the left and the customer on the right.
In a digital environment, the supplier may be a data source, partner, platform, or internal enabling function. The customer may be external or internal. The important point is to identify who receives the outcome and what they value.
Process and Data Boxes
A process box represents a meaningful stage where work is performed or transformed. It may represent a team, department, machine, service activity, or decision point.
A data box beneath it records measures such as:
- Cycle time.
- Processing time.
- Queue time.
- Availability.
- Work in progress.
- Rework rate.
- First-pass yield.
- Capacity.
- Percentage complete and accurate.
The level of detail should match the purpose of the map. Too many process boxes turn the exercise into detailed process mapping and obscure the end-to-end flow.
Inventory and Queue Symbols
Inventory is normally shown as a triangle between process stages. In knowledge work, it represents backlogs, cases, requests, changes, or decisions waiting for attention.
Queues are often the largest source of delay. A task may require only two hours of active work but take three weeks to complete because it spends most of its life waiting.
Where possible, record queue size, average age, oldest item, and the reason work is waiting.
Which Symbol Represents Information Flow?
Within the value stream mapping process, manual information flow is usually shown with a straight arrow, while electronic information flow is shown with a zigzag or lightning-shaped arrow.
These arrows can represent instructions, approvals, reports, system messages, workflow signals, or demand information. They should be labelled with the type and frequency of information because the information flow often determines when operational work can begin.
Push, Pull, and FIFO Symbols
A push arrow shows work moving downstream because the upstream activity has completed it, whether or not the next activity is ready.
A pull system allows downstream demand or available capacity to trigger new work. In digital settings, this may involve work-in-progress limits and teams selecting new items only when capacity is available.
A FIFO lane, meaning first in, first out, represents a controlled queue processed in arrival order. It should normally have a capacity limit.
Timeline Symbols
The timeline at the bottom of the map separates processing time from waiting time. It provides total lead time, active work time, and the proportion of elapsed time spent creating value.
This often reveals that delay is caused less by the time required to perform tasks and more by the time work spends waiting for capacity, information, approval, or coordination.
Kaizen Bursts
A kaizen burst is a star-shaped symbol used to mark an improvement opportunity, such as removing an approval, reducing rework, limiting work in progress, or clarifying decision rights.
Each burst should eventually connect to an owner, outcome, and implementation action.
The Value Stream Mapping Process: Ten Steps
The value stream mapping process should follow a disciplined sequence, beginning with customer value and direct observation before progressing to current-state analysis, future-state design, and implementation.
Step 1: Define the Customer and Value
The value stream mapping process begins by identifying who receives the outcome and what value means from their perspective.
Value may include the required result, quality, delivery time, experience, reliability, safety, or regulatory outcome. Without this definition, mapping can become an internal efficiency exercise that reduces cost without improving what the customer receives.
Step 2: Select and Scope the Value Stream
A focused value stream mapping process needs clear boundaries. Select a product family, service, customer journey, or recurring workflow and define an explicit start and end point.
Examples include order to delivery, idea to customer adoption, claim to settlement, or incident to service restoration.
The scope should be broad enough to show end-to-end flow but narrow enough to support action. Record both what is included and what is excluded.
Step 3: Assemble a Cross-Functional Team
The value stream mapping process should involve people who collectively understand and operate the flow.
Include frontline practitioners, relevant functions, the process or value stream owner, customer representation, and specialists in areas such as technology, finance, risk, or architecture where they materially affect the stream.
Senior leaders can provide context and remove obstacles, but the map should reflect how work actually happens rather than how leaders assume it happens.
Step 4: Walk the Value Stream and Gather Data
Direct observation is essential to the value stream mapping process. Follow real work through the system, review timestamps and backlogs, observe approvals, and identify workarounds or manual steps.
Use representative data rather than averages alone, because averages can hide old work, rework, demand variation, and congestion.
The gap between the documented process and the real process is often one of the most useful findings.
Step 5: Draw the Current-State Map
The current-state map is the central visual output of the value stream mapping process.
Begin with customer demand, then add the main process stages, data boxes, queues, information flows, rework loops, and the timeline. Show the real route taken by work, including informal steps and delays.
Use clear labels, consistent units, a legend, and version information. Do not simplify the current state merely to make it appear orderly.
Step 6: Identify the Eight Types of Waste
The value stream mapping process uses lean waste categories to identify resources consumed without improving the customer outcome.
The eight wastes are:
- Defects: errors, failed tests, rejected work, and correction.
- Overproduction: creating more work, or starting it earlier, than the system needs.
- Waiting: delay caused by approvals, dependencies, unavailable capacity, or missing information.
- Non-utilised talent: failing to use people’s knowledge and judgement.
- Transportation: unnecessary movement of materials or information.
- Inventory: work that has started but is not complete.
- Motion: searching, switching systems, or attending avoidable meetings.
- Extra-processing: duplicate approvals, reporting, data entry, or unnecessary detail.
Waste usually reflects system design rather than individual effort.
Step 7: Analyse Flow Metrics
Metrics give the value stream mapping process an evidence base.
Key measures include:
- Cycle time: time required to complete work at one process stage.
- Lead time: total elapsed time from the chosen start to the end.
- Value-added time: time directly spent creating the outcome the customer values.
- Work in progress: work started but not finished.
- Throughput: items completed within a period.
- First-pass yield: proportion completed correctly without rework.
Process cycle efficiency can be calculated as:
Value-added time ÷ total lead time × 100
The objective is not to maximise one metric in isolation, but to understand whether flow, quality, predictability, and customer outcomes are improving together.
Step 8: Design the Future State
The future-state stage of the value stream mapping process defines how work, decisions, information, and feedback should move after an achievable period of improvement.
Consider:
- Removing or combining unnecessary activities.
- Replacing push with pull.
- Limiting work in progress.
- Reducing batch sizes.
- Moving decisions closer to the work.
- Improving the quality and timing of information.
- Removing dependencies.
- Introducing earlier customer feedback.
- Automating genuine sources of delay or error.
The future state should be credible rather than idealised. It should identify improvements that can begin immediately and those requiring wider changes to policy, technology, governance, or structure.
Step 9: Build an Improvement Roadmap
The value stream mapping process must translate the gap between current and future states into a prioritised plan.
For each intervention, define the problem, expected outcome, owner, timing, dependencies, measures, and review date.
Do not launch every improvement at once. Excessive transformation work creates another form of inventory and competes with operational delivery for the same capacity.
Step 10: Implement, Measure, and Iterate
The value stream mapping process does not end when the future-state diagram is complete. Implementation must be measured against lead time, quality, work in progress, customer outcomes, and other relevant indicators.
As improvements are made, the future state becomes the new current state:
Observe, map, improve, measure, learn, and map again.
Documenting and Presenting a Value Stream Map
When presenting the value stream mapping process, separate the detailed working map from the leadership narrative.
The working pack should preserve data, assumptions, disagreements, current and future states, improvement opportunities, and open questions.
A senior leadership presentation should focus on:
- Customer outcome and scope.
- Current performance.
- Main sources of delay, cost, or risk.
- Business impact.
- Proposed future state.
- Priority interventions.
- Decisions required.
- Measures and implementation plan.
Large maps should be provided separately or in an appendix. Use enlarged sections in the main presentation to explain important findings.
The purpose is not to prove that a workshop took place. It is to secure decisions that improve the system.
Tools and Templates for Value Stream Mapping
The tool should suit the maturity and purpose of the exercise.
- Paper and sticky notes are effective for collaborative workshops.
- Miro, Mural, or Microsoft Whiteboard support remote and hybrid mapping.
- Lucidchart or Microsoft Visio are useful for formal, controlled diagrams.
- Lean-specific tools can automate calculations and standard notation.
- Process-mining and value stream management platforms can provide continuous data from enterprise systems.
Software can reveal movement through recorded systems, but it may not capture informal decisions, political constraints, missing customer feedback, or work performed outside official tools.
Limitations and What Comes Next
At enterprise scale, the value stream mapping process should be treated as a diagnostic input into organisational design rather than a complete answer to questions of ownership, governance, funding, architecture, and strategy.
A value stream map is a snapshot. Its quality depends on the chosen boundaries, available data, and willingness of participants to describe the real system.
Common limitations include:
- Focusing on speed while neglecting resilience or quality.
- Treating all non-value-adding work as removable.
- Confusing a future-state diagram with implemented change.
- Automating a poor process.
- Ignoring incentives, power, funding, and organisational boundaries.
- Optimising a flow that does not contribute meaningfully to strategy.
Where Mapping Ends and Operating Model Design Begins
A map explains how work moves. An operating model determines how the organisation is configured to sustain that flow.
Operating model design addresses:
- Which value streams should exist.
- How they contribute to strategy.
- Who owns their outcomes.
- How teams and capabilities are aligned.
- Where decision rights sit.
- How investment and capacity are allocated.
- Which governance and measures are required.
- How architecture enables or obstructs flow.
Without these decisions, an organisation may improve one workflow temporarily while leaving the structural causes of delay intact.
This distinction is central to Strategic Value Streams. A value stream is not merely a chain of process boxes. It is a durable organisational construct through which strategy is translated into customer and stakeholder outcomes.
Organisations exploring this wider challenge can read more about how to design a target operating model around value streams.
Governance, Funding, and Ownership
Mapping often exposes problems that the mapping team cannot solve alone.
A value stream owner needs sufficient visibility, influence, and decision rights to address end-to-end constraints.
Governance should establish guardrails and escalation routes without forcing every decision through a central committee.
Funding should support durable streams rather than repeatedly assembling and disbanding teams around temporary projects.
Performance measures should connect operational flow to customer outcomes, value realisation, resilience, risk, and strategic contribution.
Aligning Mapping with Strategy-to-Delivery Flow
Value stream mapping is most useful when it sits within a larger chain:
Strategy defines required outcomes.
Customer and stakeholder needs define value.
Strategic value streams provide durable pathways for creating that value.
The operating model aligns ownership, teams, governance, funding, architecture, and measurement.
Mapping diagnoses how work currently flows.
Improvement changes the system.
Measurement confirms whether value was realised.
A perfectly efficient flow that delivers an unwanted or strategically irrelevant outcome remains weak.
Scaling Across the Enterprise
Scaling does not mean creating one enormous map. Use connected levels:
- An enterprise value stream landscape.
- End-to-end maps for major streams.
- Product or service delivery maps.
- Detailed process maps for specific constraints.
The levels should use common definitions and link process improvements to value stream outcomes and strategic objectives.
Certification and Professional Development
Professionals increasingly need to understand more than mapping notation. They must connect customer value, flow, operating model design, funding, governance, architecture, and strategy.
The Strategic Value Streams professional pathway addresses this broader enterprise context.
What the Body of Knowledge Covers
The Strategic Value Streams Body of Knowledge provides an integrated reference for enterprise value stream operating models.
It covers:
- Customer and stakeholder value.
- Strategy and competitive advantage.
- Organisational viscosity.
- Value stream identification and boundaries.
- Operating model design.
- Ownership and decision rights.
- Demand, flow, and capacity.
- Measurement.
- Risk and change.
- Funding and interventions.
- Governance.
- Enabling architecture.
- Strategy-to-delivery alignment.
Foundation and Practitioner Certification
The Foundation certification validates understanding of the core concepts and terminology.
The published format includes:
- 68 questions.
- 60 minutes.
- Online delivery.
- 60 per cent pass mark.
- Digital certificate and badge.
The Practitioner certification assesses the application of those concepts to operating model choices and organisational problems.
The published format includes:
- 102 questions.
- 90 minutes.
- Multiple-choice and multiple-response questions.
- 60 per cent pass mark.
- Digital certificate and badge.
Foundation is a prerequisite for Practitioner.
Conclusion
The value stream mapping process remains one of the most effective ways to reveal how work moves through an organisation, where value is delayed, and why locally sensible decisions can combine to create poor end-to-end performance.
It makes waiting, queues, hand-offs, rework, information gaps, and local optimisation visible. It gives cross-functional teams a common language and provides a disciplined route from current-state evidence to future-state improvement.
Its strategic value depends on what happens next. A map may reveal fragmentation, but sustained improvement can require changes to ownership, governance, funding, decision rights, measures, team design, and architecture.
For organisations ready to move beyond diagnostic mapping, the next step is to understand how these elements combine within a value stream operating model.
Value stream mapping helps an organisation see the flow. Strategic value stream operating model design creates the conditions through which that flow can endure.
FAQs
What Is the Difference Between Value Stream Mapping and Process Mapping?
Process mapping explains the sequence of tasks within a specific process. Value stream mapping examines how multiple processes, queues, information flows, and hand-offs combine to deliver a customer outcome.
A process map explains how work is performed. A value stream map explains how the wider system performs.
Can Value Stream Mapping Be Used Outside Manufacturing?
Yes. It can be applied to software delivery, financial services, healthcare, government, recruitment, procurement, legal services, customer support, and other forms of knowledge work.
The notation may be adapted, but the principles of customer value, flow, waiting, quality, and waste remain relevant.
How Long Does a Mapping Exercise Take?
A tightly scoped workshop may take one day. A typical current-state and future-state exercise may take two to five days. Complex enterprise work may require several weeks of observation, data collection, validation, and decision-making.
What Software Can I Use?
Common options include paper and sticky notes, Miro, Mural, Microsoft Whiteboard, Lucidchart, Visio, lean-specific software, process-mining platforms, and enterprise value stream management tools.
Choose according to the scope, data needs, collaboration model, and whether the map will remain a workshop artefact or become a managed enterprise asset.
Is Value Stream Mapping the Same as Value Stream Management?
No. Value stream mapping is a diagnostic technique. Value stream management is the continuing practice of measuring, governing, and improving value delivery.
Strategic Value Streams goes further by addressing how the organisation is designed around durable value streams, including ownership, governance, funding, measurement, and architecture.
How Often Should a Value Stream Map Be Updated?
Review it when customer demand, regulation, technology, suppliers, operating practices, or strategy change materially. It should also be updated after major improvement interventions so that the future state becomes the new current state.